How to Debug a Broken Web Page (Step-by-Step)
Learn a calm troubleshooting workflow for broken HTML, CSS, file paths, and JavaScript behaviour.
A Broken Page Is a Clue, Not a Disaster
A broken web page can feel chaotic. The layout collapses, a button stops responding, an image disappears, or the whole screen turns blank. In that moment, many learners start changing random code and hoping something works.
That approach usually makes the problem harder to understand. Debugging gets easier when you slow down and treat the browser like a source of evidence instead of an enemy.
This lesson gives you a calm, repeatable workflow for tracking down broken HTML, CSS, file-path, and JavaScript problems one step at a time.
- What do you usually do first when a page breaks?
- Have you ever fixed a bug by accident without understanding what caused it?
- Which feels harder right now: spotting the problem or knowing where to look next?
This troubleshooting lesson comes after the main builder-path CSS and project work because learners now have enough real code to debug. The goal is to make the next broken page feel manageable rather than mysterious.
Learning Objectives
By the end of this lesson, you'll be able to:
- Describe Describe a broken-page symptom clearly before editing code
- Use the browser Console as an early source of evidence
- Inspect HTML structure and CSS rules to find mismatches
- Check file paths and loading failures with the Network panel
- Apply Apply a repeatable one-change-at-a-time debugging workflow
Why This Matters:
Troubleshooting is a professional skill, not a sign that you are failing. A repeatable debugging workflow helps you learn faster and protects you from random guessing.
Before You Start:
You should be familiar with:
- Black Swan Bistro - Part 4B: Polish and Refine Review here
- Cascade, Specificity, and Debugging CSS Review here
Why Pages Break in Different Ways
When learners say a page is broken, they often mean one of several different things. The page may load but look wrong. It may look fine but have a button that does nothing. It may be missing an image or stylesheet. Or it may fail so badly that the browser stops running JavaScript altogether.
That is why the first debugging step is not fix it. The first step is to identify the kind of failure you are seeing.
Four Common Layers of Broken Behaviour
- HTML structure: the wrong element, missing class, invalid nesting, or missing attribute
- CSS: the right structure exists, but styles do not apply or conflict
- File loading: a stylesheet, image, script, or page is not being found
- JavaScript: the page loads, but interactive behaviour fails because the code errors or never runs
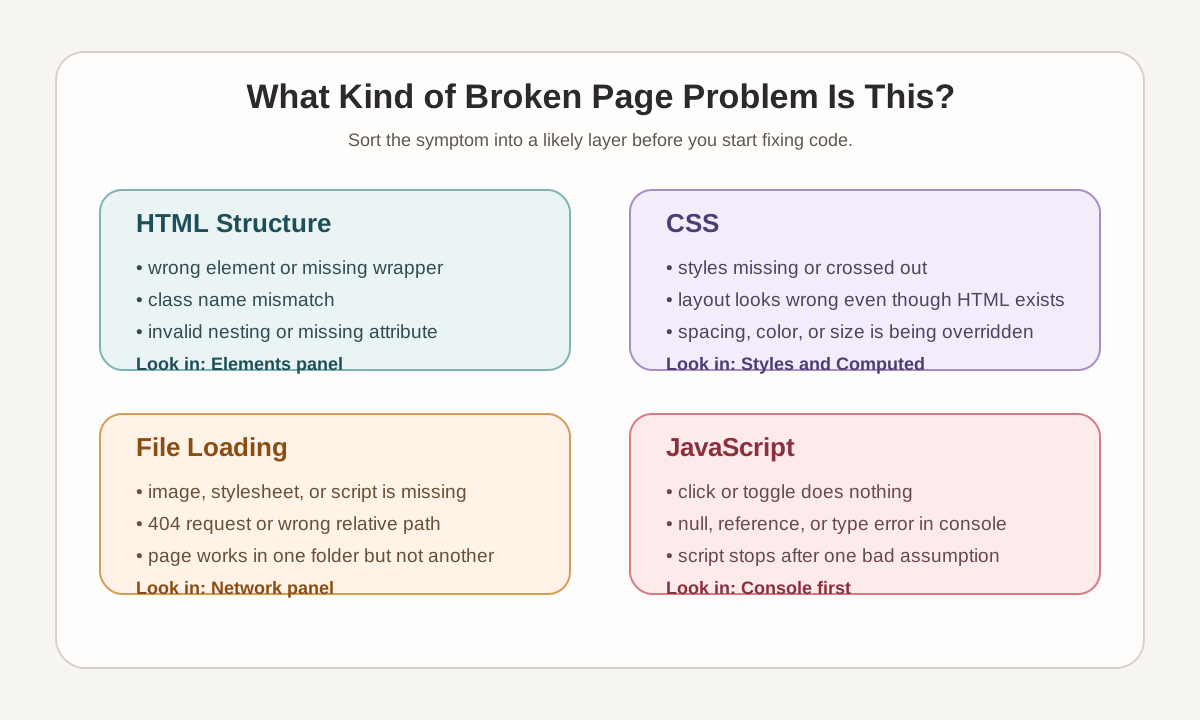
Helpful mindset: a broken page is usually not one giant mystery. It is usually one smaller problem that is showing itself through visible symptoms.
The Debugging Loop
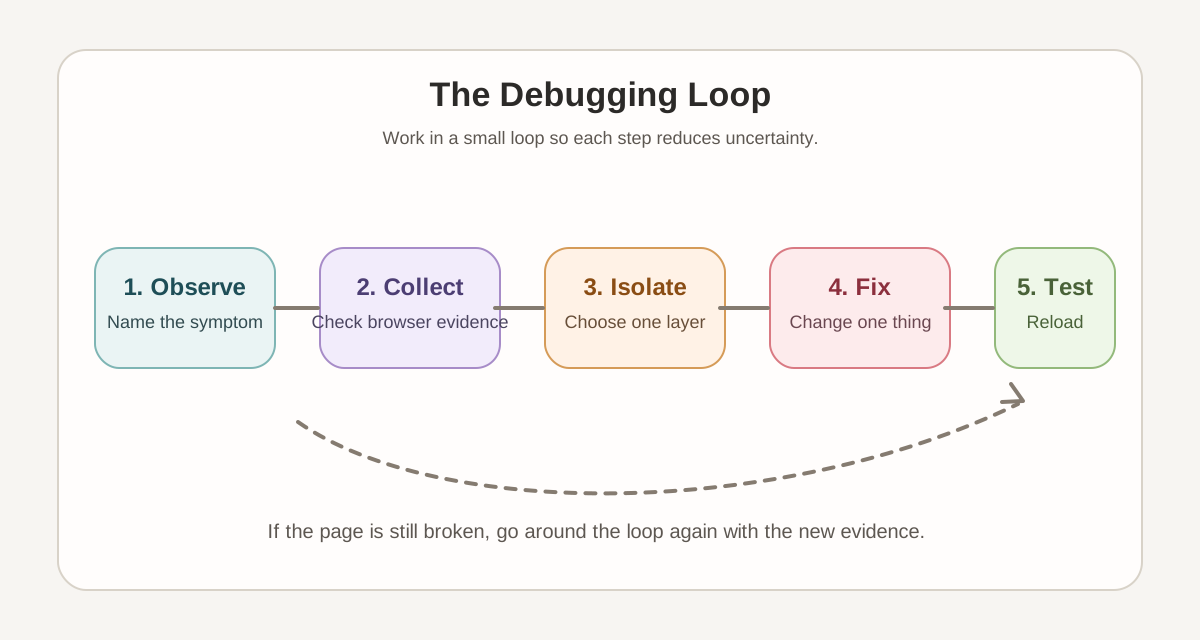
Good debugging is not random. It follows a loop:
- observe the symptom clearly
- collect evidence from the browser
- choose the most likely layer
- make one small fix
- retest and learn from the result
This loop matters because it keeps your thinking connected to evidence. When you skip straight to editing code, you often solve the wrong problem or create a new one on top of the first.
Start with the Console
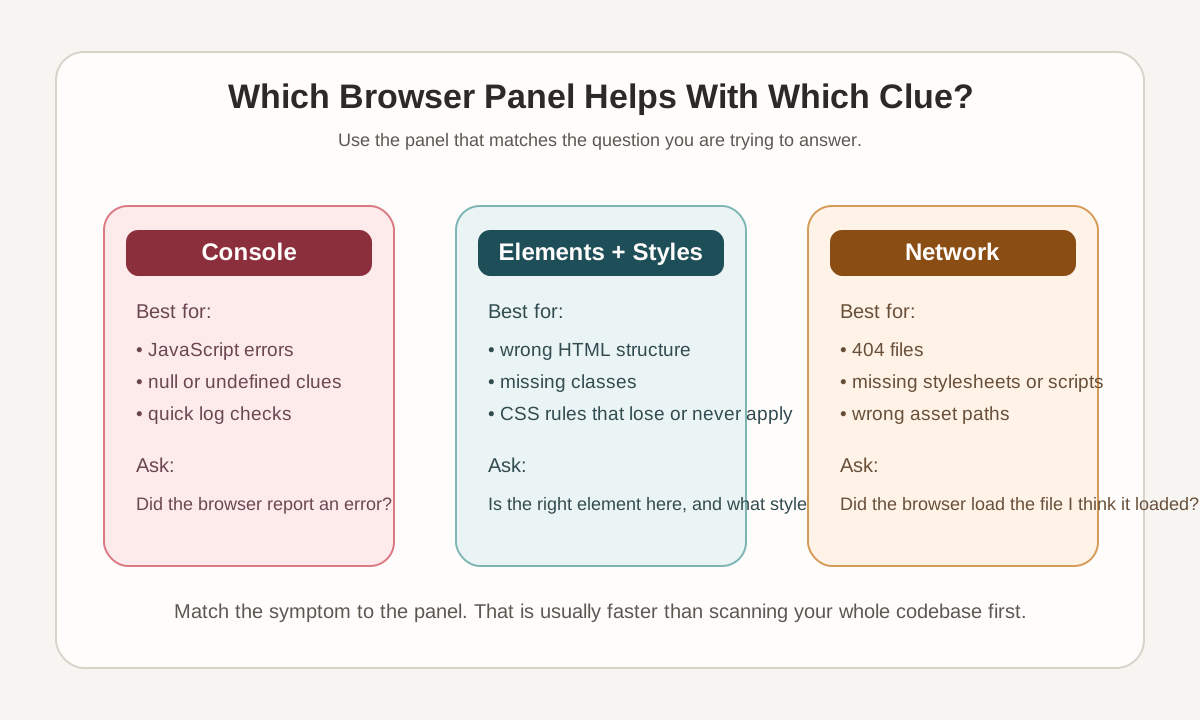
If something suddenly stops working, open DevTools and check the Console before you rewrite anything. The console often tells you exactly what the browser already knows.
Console clues often look like this
Uncaught ReferenceError: menuButton is not defined
Failed to load resource: the server responded with a status of 404
Uncaught TypeError: Cannot read properties of null
Each of those messages points in a different direction. A reference error often means a variable name is wrong or unavailable. A 404 points to a file path or missing file. A null error often means JavaScript is trying to use an element the browser did not find.
Checkpoint for Understanding
Pause here and make sure the basic troubleshooting rhythm is clear before you dive into specific panels and bug types.
- If the page looks wrong but still loads, what should you do before editing code?
- Why is the browser console often the best first stop when a page suddenly breaks?
- Predict what happens if you change three different things before testing any of them.
Show sample answers
- Describe the exact symptom first. Notice what still works, what is broken, and whether the problem looks like structure, styling, missing files, or JavaScript behaviour.
- Because the console often shows direct error messages for missing files, JavaScript exceptions, and failed requests. It can tell you what the browser already knows instead of making you guess.
- You lose the evidence trail. If the page improves or gets worse, you no longer know which change caused it.
How confident are you with this concept?
Still confused | Getting there | Got it | Could explain it to a friend
Inspect HTML and CSS Before Assuming the Browser Is Wrong
If the page loads but looks wrong, inspect the broken element. The Elements panel lets you check whether the HTML you expected is actually on the page. This is where you catch problems like:
- a class name in HTML that does not match the CSS selector
- a missing wrapper that the layout depends on
- a button rendered as the wrong element
- content appearing in a different order than expected
Once the structure looks right, move to the Styles and Computed panels. Check whether the rule is missing, crossed out, or overridden. That tells you whether the problem is absent CSS, conflicting CSS, or the wrong HTML hook.
A common mismatch
HTML
<a class="nav-link">Menu</a>CSS
.site-nav__link {
  color: #1f3a44;
}
The CSS is not wrong in isolation. It just targets a different class name from the one the browser is actually rendering.
Check Files and Paths When Assets Are Missing
If an image does not appear, a stylesheet is not loading, or a script never runs, do not stay only in the code editor. Open the Network panel and reload the page.
This is where you can see whether the browser asked for the file at all, whether it found it, and what path it tried to use. A missing stylesheet or script can make a whole page look broken even though the HTML is fine.
Path problems often come from details like:
css/style.cssvs./css/style.cssin the wrong folder context- moving from one page to multiple pages without updating relative paths
- renaming a file but not updating the HTML reference
- wrong image file extension such as
.jpgvs.png
<link rel="stylesheet" href="css/style.css">
<img src="images/dining-room.jpg" alt="Dining room">
<script src="js/menu.js"></script>
Each of those references is a promise that the browser will find a file in that location. If the path is wrong, the browser cannot keep the promise, no matter how good the CSS or JavaScript is.
Test JavaScript Assumptions One by One
When a click handler or interactive feature stops working, the bug is often not in the whole script. It is usually in one assumption the script made.
Common examples include:
- the selector does not match any element
- the script runs before the element exists
- the variable name is misspelled
- an earlier error stops the rest of the script from running
A typical JavaScript debugging check
const menuButton = document.querySelector('.menu-toggle');

console.log(menuButton);

menuButton.addEventListener('click', () => {
  console.log('clicked');
});
If the first console.log prints null, the browser did not find the element. That means the next line is likely to fail. At that point, you stop and investigate the selector or the timing, rather than editing the event listener itself.
A Step-by-Step Checklist You Can Reuse
When a page breaks, run through this checklist in order:
- Name the symptom: what exactly is wrong?
- Check the Console: is the browser already showing an error?
- Inspect the element: is the expected HTML actually present?
- Check Styles and Computed: is the CSS missing or overridden?
- Check Network: did a stylesheet, image, or script fail to load?
- Test one assumption: what is the simplest thing that could be false?
- Make one fix: change one thing only
- Retest: what changed, and what does that tell you?
Professional habit: every failed debugging attempt can still be useful if it rules out a wrong assumption clearly.
Guided Practice: Troubleshoot One Visible Bug
Step 1: Name the symptom before touching code
Open a page you have built recently, ideally one from Black Swan Bistro or another tutorial project. Pick one visible bug or pretend one exists.
Write one sentence that describes the problem plainly, such as The navigation links are unstyled, The menu cards are stacked in the wrong order, or The button click does nothing.
Need a hint?
Step 2: Gather browser evidence
Open DevTools. Check the Console for red errors and warnings. Then inspect the broken element in the Elements panel and open the Network panel if the issue might involve a missing file.
Write down the strongest clue you find.
Need a hint?
Step 3: Isolate one likely layer
Choose the one layer that seems most likely: HTML structure, CSS, file path/loading, or JavaScript.
Check that layer only. For example, if a class is missing in the Elements panel, stay with HTML and CSS first. If the browser shows 404, stay with the file path problem first.
Need a hint?
Step 4: Make one fix and retest
Apply one small fix. Reload the page and ask: did the symptom change, stay the same, or reveal a deeper issue?
If it changed, you learned something. If it did not, undo the assumption and check the next strongest clue.
Need a hint?
You're on track if you can:
- You described the bug in plain language before editing code
- You checked the browser for evidence instead of guessing first
- You isolated one likely layer before fixing anything
- You made one change at a time and retested after each change
Independent Practice: Diagnose a Small Broken Page Problem
Now try this on your own without hints!
Your Task:
Choose a small page problem from one of your own projects or create one deliberately. Good examples include a missing image, a button that does not respond, a class name mismatch, a broken stylesheet link, or a layout rule that is not applying.
Use the debugging checklist from this lesson to identify the symptom, collect evidence, make one fix, and confirm the result.
Requirements:
- Write one sentence describing the visible symptom before debugging
- Use at least one browser panel as evidence: Console, Elements, Styles, Computed, or Network
- Name the layer where the bug lived: HTML, CSS, file path, or JavaScript
- Make one targeted fix and retest the page
Success Criteria:
| Criteria | You've succeeded if... |
|---|---|
| Clear diagnosis | The learner can explain whether the bug came from structure, CSS, file loading, or JavaScript behaviour. |
| Evidence-based workflow | The learner refers to a browser clue such as a console error, a missing class, a 404 request, or a failed event. |
| Scoped fix | The learner makes a targeted correction rather than rewriting large sections of code. |
| Retest habit | The learner reloads or rechecks the page after each meaningful change and notices what changed. |
Recap
Debugging a broken page gets easier when you stop treating it like a personal failure and start treating it like evidence gathering. The browser can show you missing files, invalid assumptions, structure mismatches, and overridden styles. Your job is to read those clues in a calm order.
The real skill is not memorising every possible bug. It is learning a repeatable way to narrow the problem until the next step becomes obvious.
What Strong Troubleshooting Looks Like
Key Takeaways:
- Debugging starts with observing the symptom clearly, not changing code immediately.
- The browser already contains useful evidence through the Console, Elements, Styles, and Network panels.
- Most broken pages can be narrowed to one layer at a time: HTML, CSS, file loading, or JavaScript.
- Small, testable fixes are easier to trust than large guessing-based rewrites.
- A repeatable debugging loop builds confidence faster than memorising isolated fixes.
Think & Reflect:
Evidence First
- When a page breaks, what do you usually do first right now?
- Which browser panel feels most useful for the kinds of bugs you hit most often?
Troubleshooting Habits
- Which kind of bug do you tend to misdiagnose: HTML structure, CSS, file paths, or JavaScript?
- How would your debugging change if you always made one fix at a time?
Recommended Next Steps
Additional Resources
Deepen your understanding with these helpful resources:
- MDN: Get started with debugging JavaScript - A practical guide to reading browser errors and narrowing JavaScript problems step by step.
- MDN: Inspect and edit HTML and CSS with DevTools - Helpful background on using browser panels to inspect structure, styles, and page behaviour.
- MDN: HTTP response status codes - Useful when the Network panel shows 404 or other loading failures.