Measuring Website Performance
Use Lighthouse and Chrome DevTools Network to establish a repeatable performance baseline before making optimisation decisions.
Start Here
Developers do not optimise websites because they feel like something might be slow.
They gather evidence. Then they decide what to do with it.
- Where have you already seen measuring website performance in a real interface?
- Which part of this topic currently feels most important to test in a real page?
Use Lighthouse and Chrome DevTools Network to establish a repeatable performance baseline before making optimisation decisions.
Learning Objectives
By the end of this lesson, you'll be able to:
- run Lighthouse
- use the Network panel
- sort requests
- identify large resources
- explain lab and field data
- record a repeatable baseline
Why This Matters:
Use Lighthouse and Chrome DevTools Network to establish a repeatable performance baseline before making optimisation decisions.
Chrome DevTools
Chrome DevTools is included with Google Chrome. No additional software is required.
On macOS, open it with Command + Option + I. On Windows or Linux, use Ctrl + Shift + I. You can also right-click the page and choose Inspect.
DevTools is one of the most important tools a frontend developer can learn because it lets you inspect what the browser actually received and did.
Lighthouse
Lighthouse is built into Chrome DevTools. It is an automated auditing tool, so treat its recommendations as diagnostic evidence rather than a to-do list.
To run your first audit:
- Open your website in Chrome.
- Open DevTools.
- Select Lighthouse.
- Choose Navigation if prompted for the audit mode.
- Select Performance.
- Select the device mode required for the exercise.
- Run the analysis.
- Wait for the report.
- Record the resulting measurements.
- Read the diagnostics before making changes.
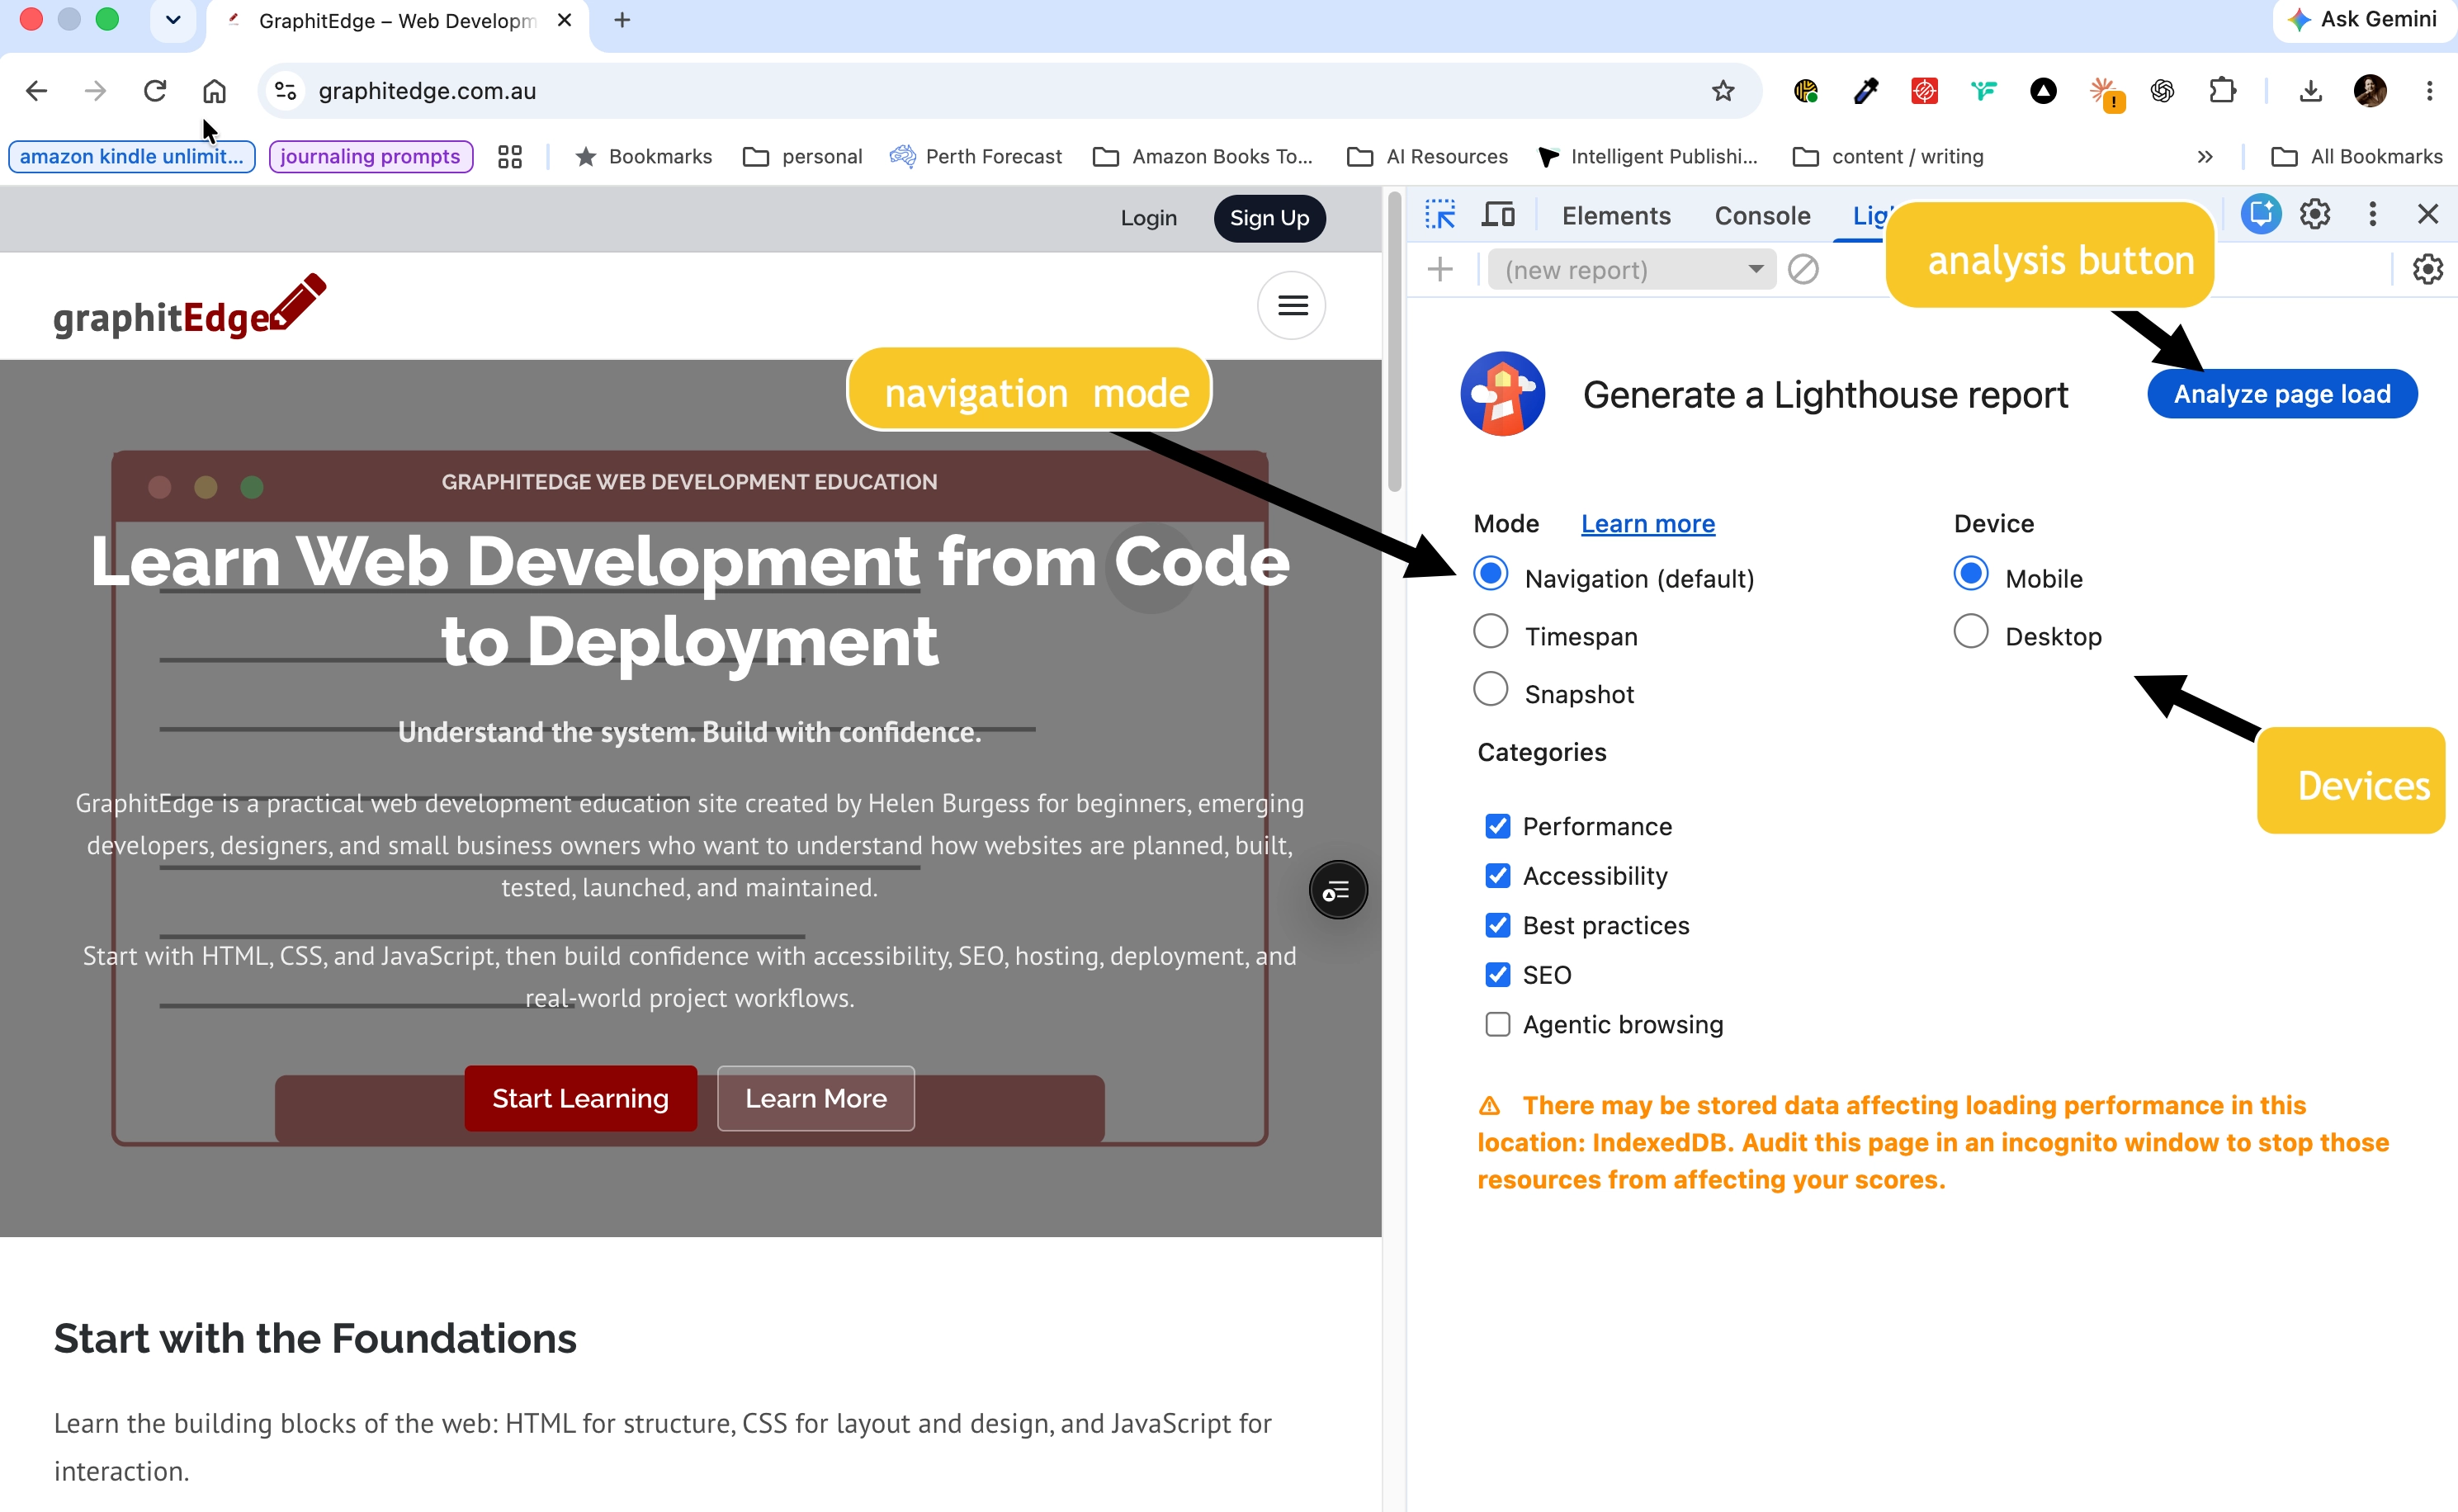
Choose the test mode, device and categories before running Lighthouse. The visible stored-data warning is a reason to use a clean test session.
Lab data and field data
Lab data is measured under controlled conditions. It is useful for debugging, repeat testing, and comparing changes.
Field data is collected from real visitors. It is useful for understanding actual devices, networks, locations, and user experiences.
They answer different questions. Lab data helps you reproduce a problem. Field data helps you understand whether real visitors are experiencing it.
Network panel
The Network panel shows the resources requested by a page.
To find the largest files:
- Open DevTools.
- Select Network.
- Reload the page.
- Wait until loading settles.
- Find the Size column.
- Sort by size.
- Identify the five largest resources.
- Record their filename, type, transferred size, and load time.
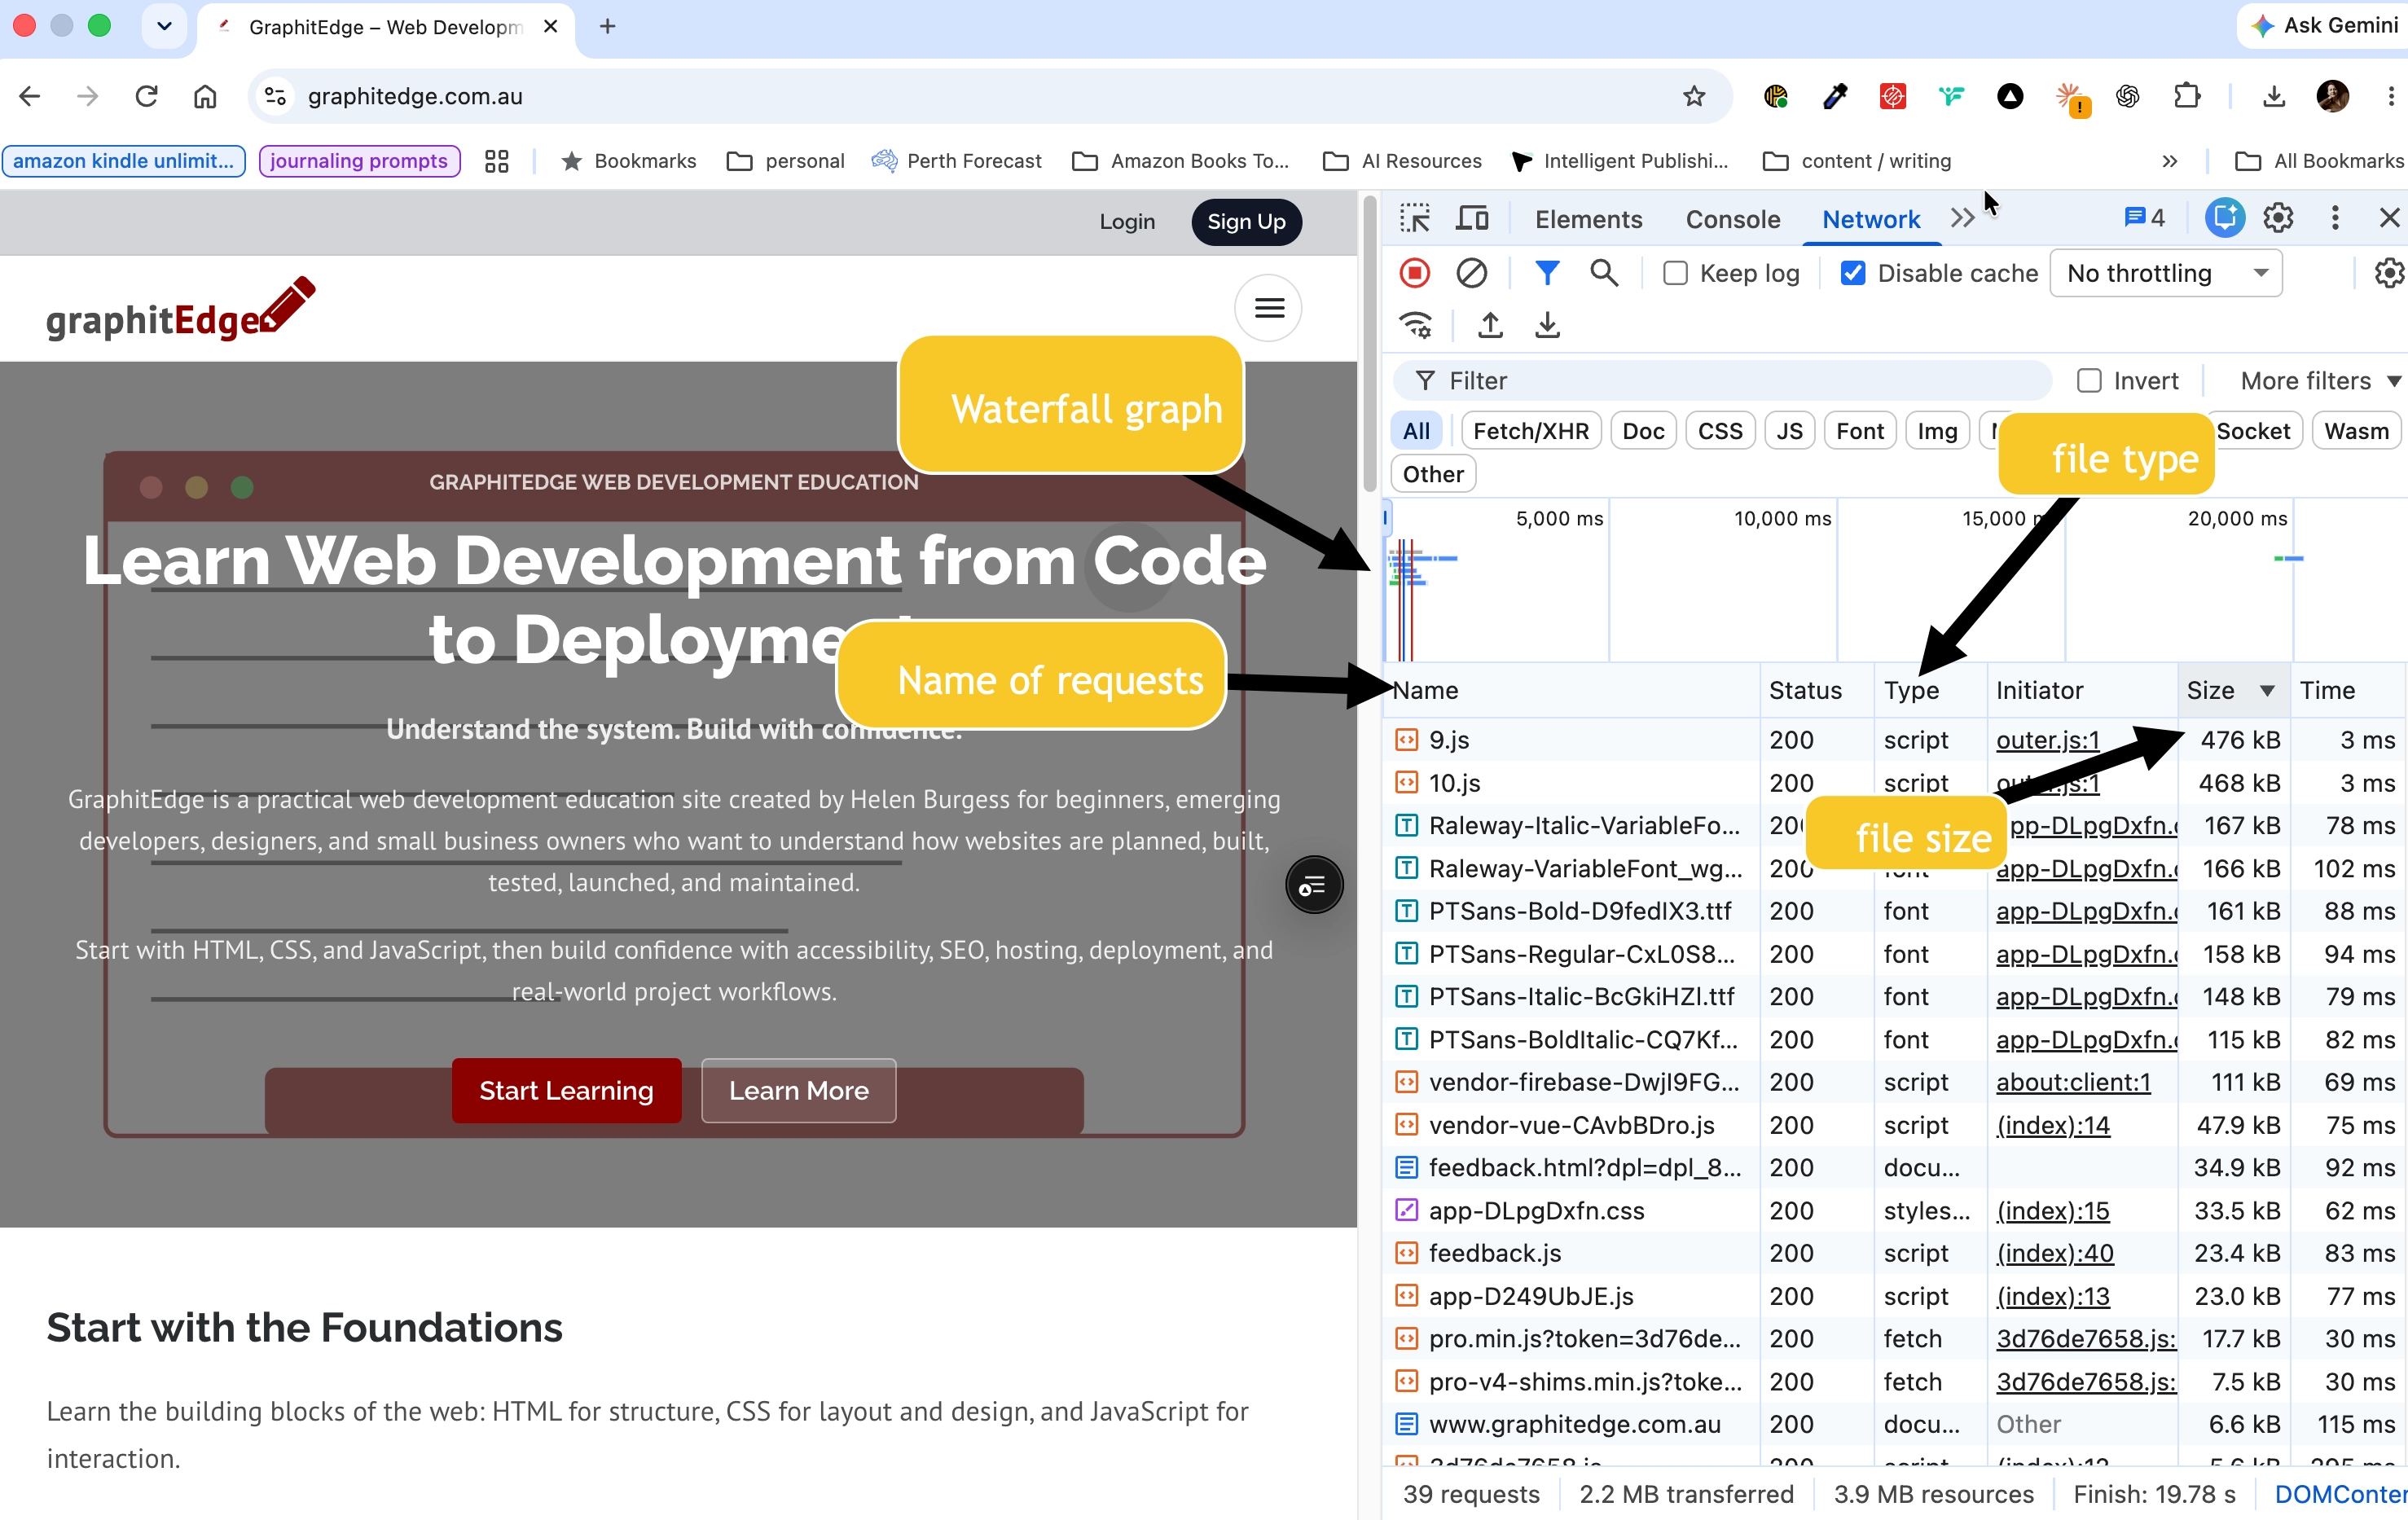
Use the Size column to find large resources, then inspect their type and request timing.
Performance baseline worksheet
Record the same information every time you test:
| Measurement | Result |
|---|---|
| Lighthouse Performance | |
| LCP | |
| INP if available | |
| CLS | |
| Total transferred | |
| Number of requests | |
| Image transfer total | |
| JavaScript transfer total | |
| CSS transfer total |
Then identify three things worth investigating. Do not change them yet.
Check Your Understanding
Before moving forward, can you answer these?
- 1. Why should Lighthouse recommendations be investigated rather than blindly followed?
- 2. What is the difference between lab data and field data?
- 3. What does the Network panel help you find?
Check Your Answers
- Because automated tools provide signals. Developers still need to understand context, user impact, effort, and risk.
- Lab data is controlled and repeatable. Field data reflects real users and real conditions.
- It helps identify requested resources, transferred sizes, timing, and the loading waterfall.
How confident are you with this concept?
Still confused | Getting there | Got it | Could explain it to a friend
Guided Practice
Establish a baseline for one website.
Step 1 - Run Lighthouse
Record the Performance score, LCP, INP if shown, and CLS.
Step 2 - Inspect Network requests
Reload the page with the Network panel open and sort by Size.
Step 3 - Record findings
Fill in the baseline worksheet and list three issues worth investigating.
Independent Practice
Run the same measurement process on a page you built earlier.
Your Task:
Run the same measurement process on a page you built earlier.
Requirements:
- use the same browser and device setting for each test
- record Lighthouse and Network data
- identify three possible investigation targets
- avoid making changes during measurement
Success Criteria:
| Criteria | You've succeeded if... |
|---|---|
| your baseline can be repeated later | Completed clearly and correctly in your solution. |
| large resources are identified from evidence | Completed clearly and correctly in your solution. |
| your notes separate measurement from optimisation | Completed clearly and correctly in your solution. |
Before you continue
- I can open DevTools.
- I can run Lighthouse.
- I can inspect Network requests.
- I can find the largest resources.
- I understand lab versus field data.
- I have recorded a baseline.
Extension activity
Test the same page twice with the same settings. Compare the results and note which numbers changed slightly. This helps you understand normal measurement variation.
Closure
Key Takeaways:
- Performance optimisation begins with evidence.
- A baseline lets you say: we changed this, and this measurement improved.
- That is considerably more useful than: it seems quicker on my laptop.
Learning Objectives Review:
Look back at what you set out to learn. Can you now:
- run Lighthouse Check!
- use the Network panel Got it!
- sort requests Can explain it!
- identify large resources Could teach this!
- explain lab and field data Check!
- record a repeatable baseline Got it!
If you can confidently answer "yes" to most of these, you're ready to move on!
Think & Reflect:
Pause and reflect
- Which idea from this lesson now feels practical rather than abstract?
- What would you build or test next to make this stick?
Looking Ahead:
- Performance optimisation begins with evidence.
- A baseline lets you say: we changed this, and this measurement improved.
- That is considerably more useful than: it seems quicker on my laptop.
Recommended Next Steps
Continue Learning
Ready to move forward? Continue with the next tutorial in this series:
Optimising Images and MediaRelated Topics
Explore these related tutorials to expand your knowledge:
Additional Resources
Deepen your understanding with these helpful resources:
- Chrome for Developers: Lighthouse - Official instructions for running and interpreting Lighthouse audits.
- Chrome DevTools: Network panel - Inspect requests, transferred sizes, timing, and loading waterfalls.
- PageSpeed Insights - Compare lab findings with available real-user field data.
- WebPageTest - Run detailed performance tests from different devices and locations.